5.MD.2:
Measurement And Data
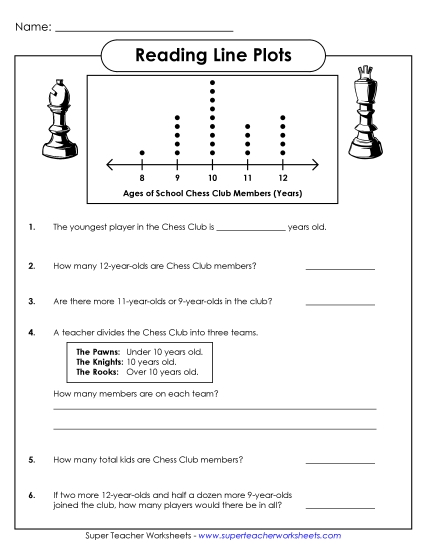
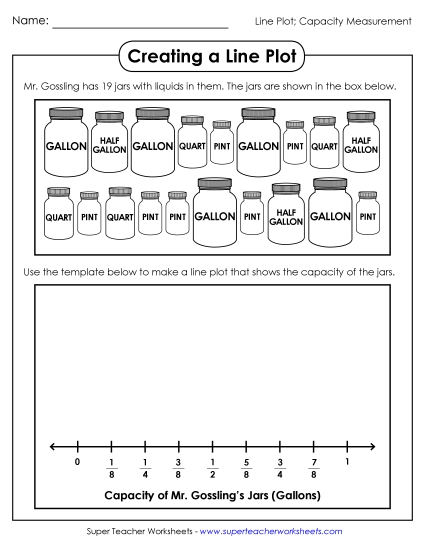
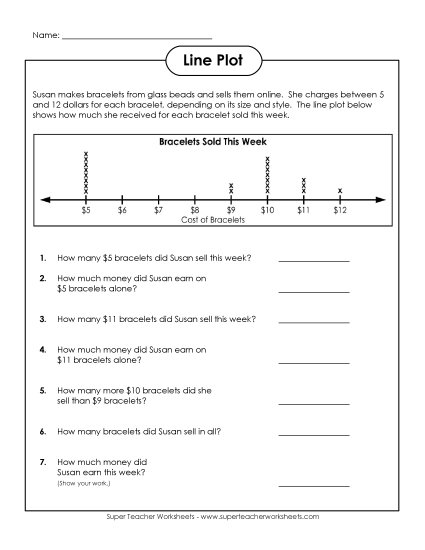
Represent And Interpret Data.
Make a line plot to display a data set of measurements in fractions of a unit (1/2, 1/4, 1/8). Use operations on fractions for this grade to solve problems involving information presented in line plots. For example, given different measurements of liquid in identical beakers, find the amount of liquid each beaker would contain if the total amount in all the beakers were redistributed equally.
4.MD.4:
Measurement And Data
Represent And Interpret Data.
Make a line plot to display a data set of measurements in fractions of a unit (1/2, 1/4, 1/8). Solve problems involving addition and subtraction of fractions by using information presented in line plots. For example, from a line plot find and interpret the difference in length between the longest and shortest specimens in an insect collection.

")