4.MD.4:
Measurement And Data
Represent And Interpret Data.
Make a line plot to display a data set of measurements in fractions of a unit (1/2, 1/4, 1/8). Solve problems involving addition and subtraction of fractions by using information presented in line plots. For example, from a line plot find and interpret the difference in length between the longest and shortest specimens in an insect collection.
6.SP.5c:
Statistics And Probability
Summarize And Describe Distributions.
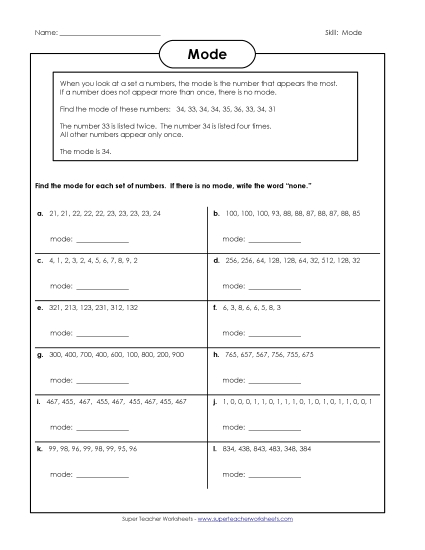
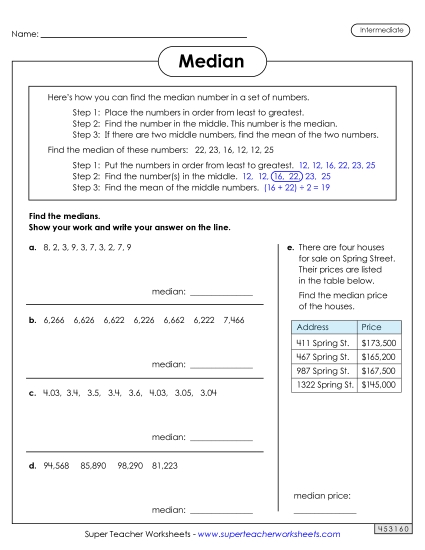
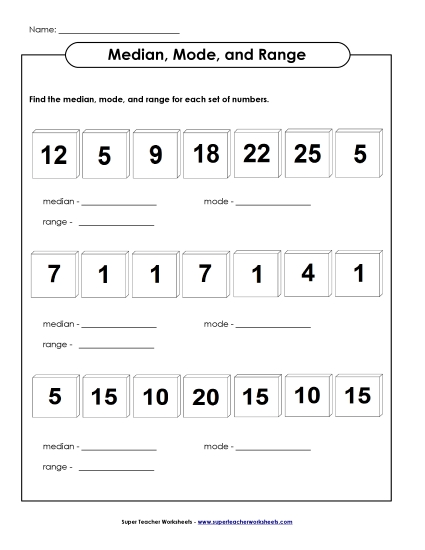
Giving quantitative measures of center (median and/or mean) and variability (interquartile range and/or mean absolute deviation), as well as describing any overall pattern and any striking deviations from the overall pattern with reference to the context in which the data were gathered.

")